Up 30% in 2 months, the Lloyds share price is nearing a 4-year high!

With the Lloyds share price on a near eight-week winning streak it may soon hit its highest level since the pandemic. Can it keep going?

| More on:

The content of this article was relevant at the time of publishing. Circumstances change continuously and caution should therefore be exercised when relying upon any content contained within this article.

Young woman working at modern office. Technical price graph and indicator, red and green candlestick chart and stock trading computer screen background.

Image source: Getty Images

When investing, your capital is at risk. The value of your investments can go down as well as up and you may get back less than you put in.

Read More

The content of this article is provided for information purposes only and is not intended to be, nor does it constitute, any form of personal advice. Investments in a currency other than sterling are exposed to currency exchange risk. Currency exchange rates are constantly changing, which may affect the value of the investment in sterling terms. You could lose money in sterling even if the stock price rises in the currency of origin. Stocks listed on overseas exchanges may be subject to additional dealing and exchange rate charges, and may have other tax implications, and may not provide the same, or any, regulatory protection as in the UK.

You’re reading a free article with opinions that may differ from The Motley Fool’s Premium Investing Services. Become a Motley Fool member today to get instant access to our top analyst recommendations, in-depth research, investing resources, and more. Learn More.

The Lloyds (LSE:LLOY) share price has been climbing practically non-stop since mid-February, closing with a higher price for six weeks in a row recently. It’s now only a few pence away from breaking a new four-year high above 56p. 

Lloyds share price
Created on TradingView.com

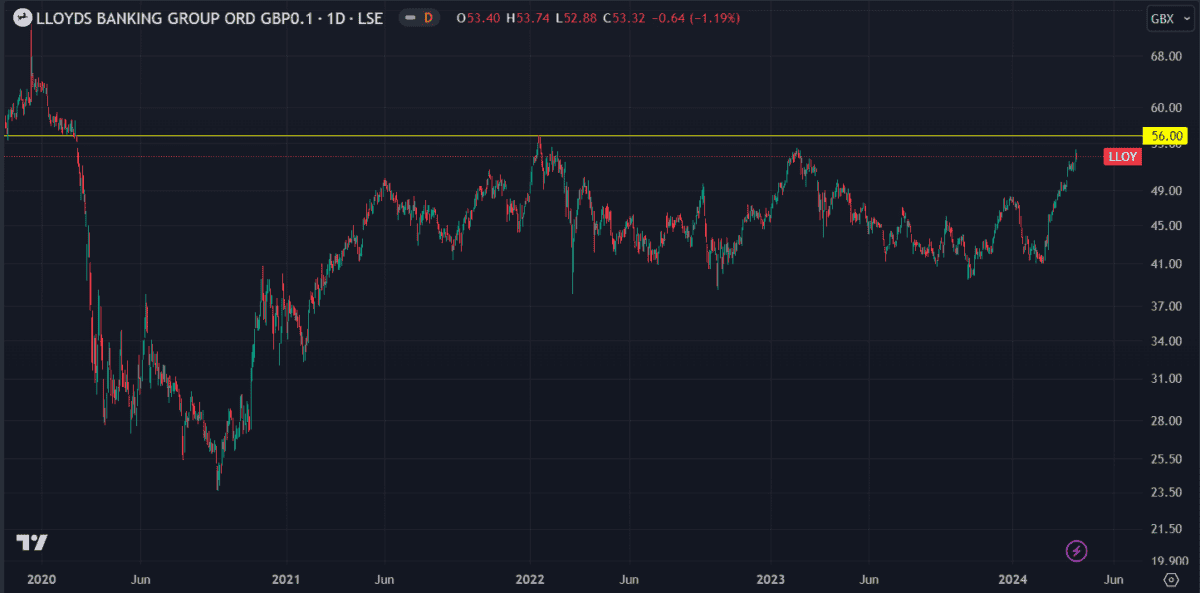
The last time it traded above that level was in February 2020 when the pandemic hit, knocking the price down from a high of 58p to 32p in less than a month. Lloyds came close to breaching this level in February last year but ultimately failed, so I’m wondering if this time is different.

Let’s see what the charts say.

UK market comparison

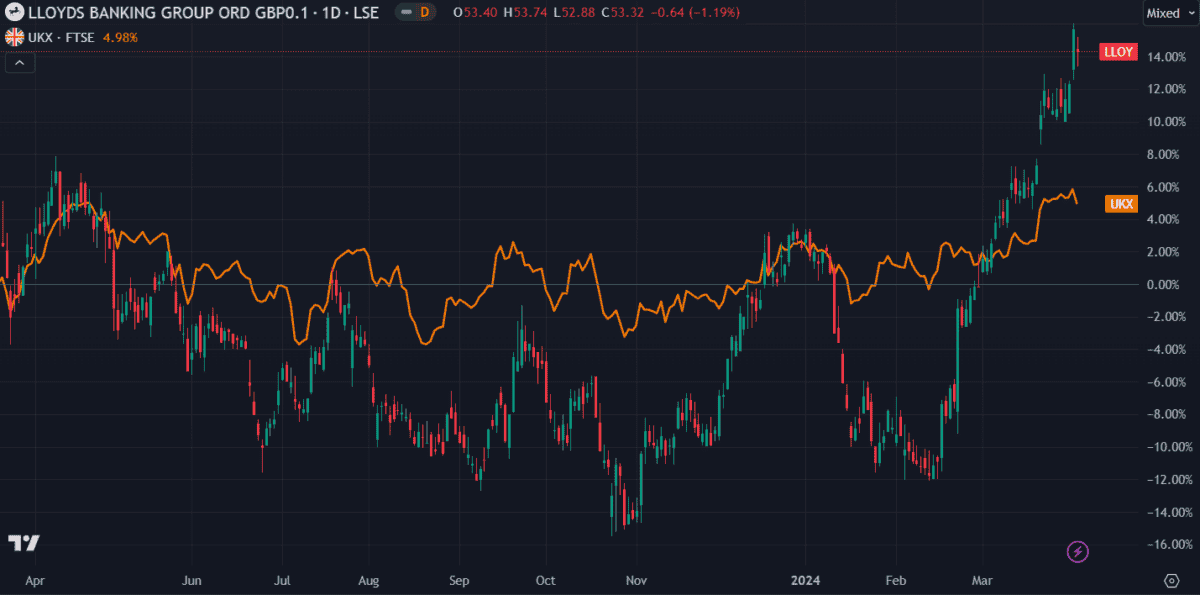
Lloyds recently overtook the FTSE 100 in percentage price gains, something it achieved briefly in January but has otherwise not done so since April last year. This indicates that it’s performing better than the average of the UK’s top 100 stocks. Whether or not this can continue is the question I hope to answer today.

Lloyds share price
Created at TradingView.com

Price-to-book ratio

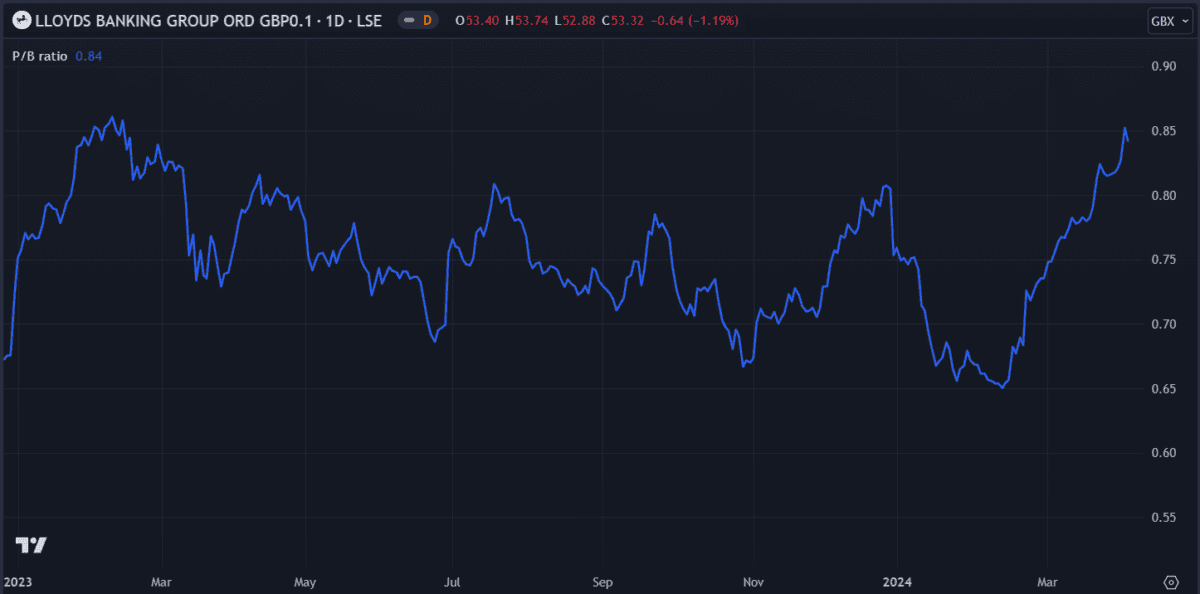
The price-to-book (P/B) ratio is calculated by dividing the current market price by the company’s book value per share. A high P/B ratio is typical in a bank with high expected earnings growth and high returns on equity.

Lloyds’ P/B ratio has been rising along with the share price since mid-February. Although it’s still in a good range, it’s nearing a value of 1, at which point the price could be considered overvalued. For now though, the P/B ratio of 0.84 suggests Lloyds shares could still climb further.

Lloyds P/B ratio
Created at TradingView.com

Return on equity

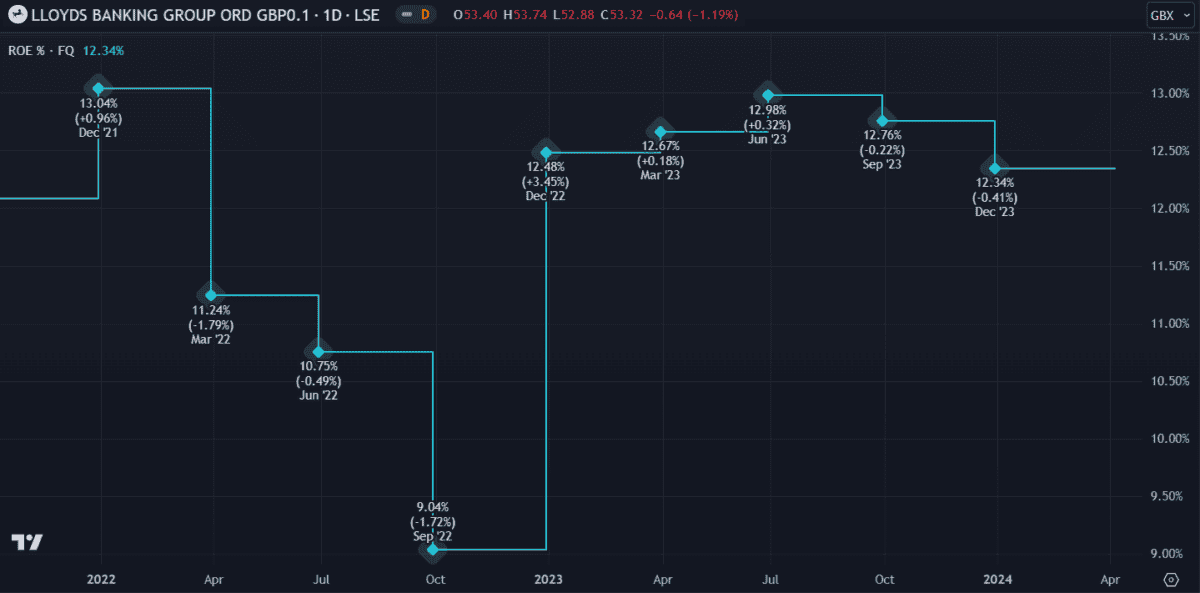
Return on equity (ROE) is a good indication of how well a company is performing based on its equity. In other words, how much profit it generates compared to the level of investment that shareholders have put into the business. While ROE doesn’t directly correlate with price, it’s a reassuring indication of a company’s operating strength.

ROE is calculated by dividing the company’s net income by its shareholder’s equity. Lloyds reported a decent ROE of 12.34% in its 2023 annual earnings report. Anything under 10% would be concerning.

Lloyds ROE
Created at TradingView.com

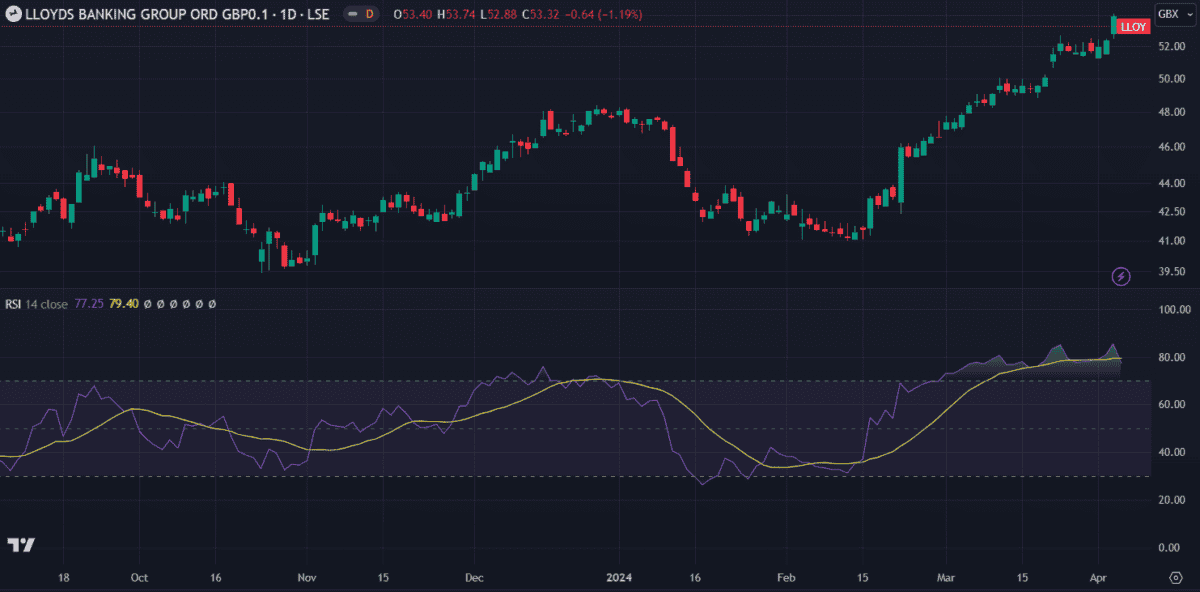
Relative strength index

The relative strength index (RSI) is an oscillator used to measure the volatility of an asset’s price movements. It can be used to forecast price targets by gauging how a stock’s price is trending.

The oscillator ranges between zero and 100, with 30 and 70 being key levels dictating whether an asset is overbought or oversold. A prolonged move above 70 is usually a sign that the asset is overbought and could decline soon.

Looking at a daily chart, I see that Lloyds’ share price declined in early 2024 following a period when the RSI ticked above 70 a few times. Looking ahead to today, I see the RSI has been above 70 for over a month now. From my point of view, it would be difficult to argue that a correction isn’t imminent.

Lloyds RSI
Created at TradingView.com

My verdict

Lloyds seems to be performing well at the moment, with the recent price gains likely boosted by the news of delayed rate cuts. While interest rates remain high, banks usually continue to profit.

However, several metrics indicate the price is overbought. While the shares could still make some gains in the short term, I wouldn’t buy them at this level.

Should you invest, the value of your investment may rise or fall and your capital is at risk. Before investing, your individual circumstances should be assessed. Consider taking independent financial advice.

Mark Hartley has no position in any of the shares mentioned. The Motley Fool UK has recommended Lloyds Banking Group Plc. Views expressed on the companies mentioned in this article are those of the writer and therefore may differ from the official recommendations we make in our subscription services such as Share Advisor, Hidden Winners and Pro. Here at The Motley Fool we believe that considering a diverse range of insights makes us better investors.

More on Investing Articles

Investing Articles

How I’d invest £10,000 in FTSE shares right now

Putting a chunk of cash into FTSE shares today, I'd look for a mix of UK dividend income and US…

Read more »

Investing Articles

The Rolls-Royce share price is down 10% since a 52-week high. Is this a buying dip?

H1 results from Rolls-Royce are just around the corner, but what might they mean for the share price? I expect…

Read more »

Investing Articles

5.5% dividend yield! Is this FTSE 100 stock a great buy for dividend growth?

A falling share price has supercharged the dividend yield on this FTSE 100 share. Here's why it could be a…

Read more »

Investing Articles

UK shares: a once-in-a-decade chance to bag sky-high passive income

The FTSE 250 is offering up incredible passive income opportunities right now. Our writer takes a look at one stock…

Read more »

Investing Articles

2 dirt cheap FTSE 100 and FTSE 250 growth shares to consider!

Looking for great growth and value shares right now? These FTSE 100 and FTSE 250 shares could offer the best…

Read more »

Investing Articles

No savings? I’d use the Warren Buffett method to target big passive income

This Fool looks at a couple of key elements of Warren Buffett's investing philosophy that he thinks can help him…

Read more »

Investing Articles

This FTSE 100 hidden gem is quietly taking things to the next level

After making it to the FTSE 100 index last year, Howden Joinery Group looks to be setting its sights on…

Read more »

Investing Articles

A £20k Stocks and Shares ISA put into a FTSE 250 tracker 10 years ago could be worth this much now

The idea of a Stocks and Shares ISA can scare a lot of people away. But here's a way to…

Read more »