Are we due a stock market crash? Here’s what the charts say

Jon Smith takes a visual look at different gauges of sentiment to try and figure out if a stock market crash is indeed on the horizon.

The content of this article was relevant at the time of publishing. Circumstances change continuously and caution should therefore be exercised when relying upon any content contained within this article.

Chalkboard representation of risk versus reward on a pair of scales

Image source: Getty Images

You’re reading a free article with opinions that may differ from The Motley Fool’s Premium Investing Services. Become a Motley Fool member today to get instant access to our top analyst recommendations, in-depth research, investing resources, and more. Learn More.

I’ve seen some articles recently that put across the potential for a stock market crash coming before the end of the year. Part of the reasoning is linked to a global economic slowdown. Further, the potential bubble in artificial intelligence (AI) stocks could deflate in coming months with the high valuations. When assessing these arguments, here’s what I can glean from the charts.

Checking out volatility

To begin with, let’s consider the volatility index for the S&P 500 (known as the VIX). At any point, the VIX gives a projection of the expected volatility on the stock market for the next month.

This gives investors a feel for how worried they should be about the chances of a large move. Granted, volatility could mean a move higher — it doesn’t necessarily mean a crash!

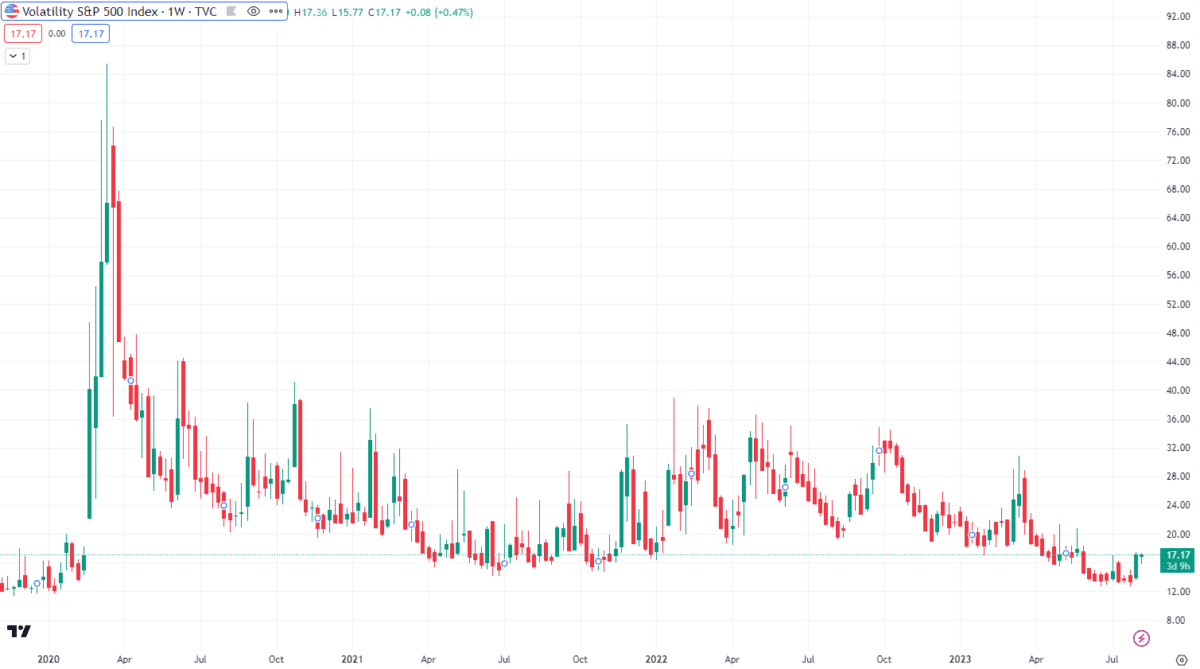
As can be seen, the sharp spike on the far left was related to the Covid-19 pandemic, which did cause a stock market crash. Yet look at where the index is trading now. It’s close to the lowest levels since the start of 2020. To me, this doesn’t indicate that anyone is expecting a large move in coming weeks.

Looking at options

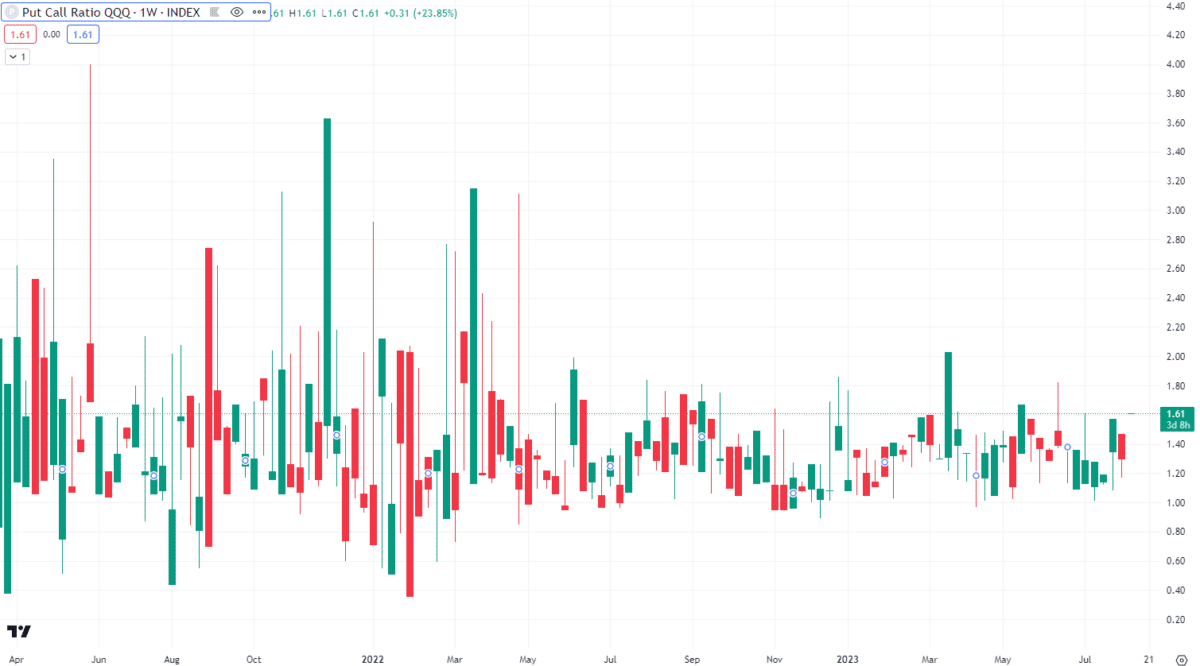
Another chart that’s useful is the put-to-call ratio for the tech heavy NASDAQ 100. A put option is a financial derivative bought if an investor thinks the market will fall. A call option is bought if an investor thinks the market will rise. These are bought by paying an upfront premium. In many ways, it’s like buying a form of insurance.

If the ratio is above one, it shows that more puts than calls are being bought. This indicates that investors are trying to hedge and protect themselves against a possible crash. The ratio is currently 1.61, so this does indicate negative sentiment. However, the ratio has been considerably higher, even just at the start of this year. Therefore, this doesn’t convince me that tech stocks are flashing red.

Noting areas of support

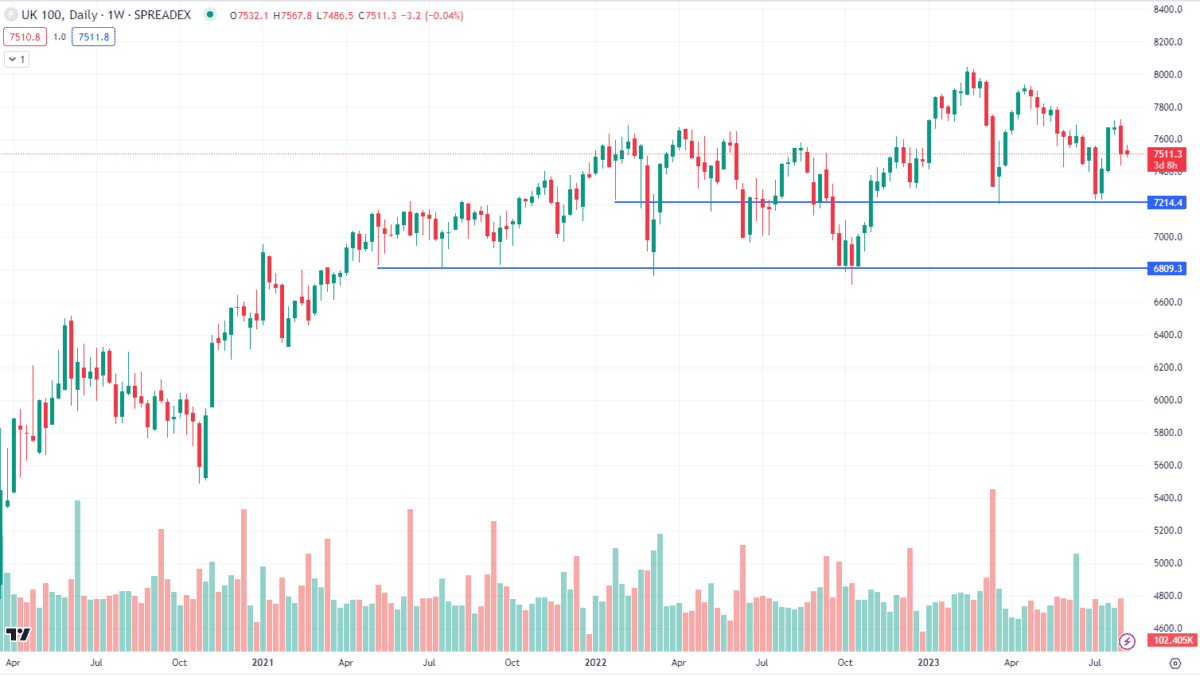
Before we can reach a stage where we have a full-on crash, it’s important to note some key levels of support in the market.

For example, below shows the FTSE 100. Over the past couple of years, buyers have often bought any dip around 7,200 points or 6,800 points.

Now this isn’t to say that the price hasn’t (and won’t) fall below there. But it’s clear that long-term value buyers in the UK have been happy to invest at those times. This has meant that the index as a whole has rallied back from those support areas.

Therefore, I won’t start getting overly concerned until the market drops below 6,800 points. Even if this does happen, I’ll use it as an opportunity to buy stocks within the FTSE 100 that will likely be undervalued.

Jon Smith has no position in any of the shares mentioned. The Motley Fool UK has no position in any of the shares mentioned. Views expressed on the companies mentioned in this article are those of the writer and therefore may differ from the official recommendations we make in our subscription services such as Share Advisor, Hidden Winners and Pro. Here at The Motley Fool we believe that considering a diverse range of insights makes us better investors.

More on Investing Articles

Illustration of flames over a black background
Investing Articles

Recently released: December’s higher-risk, high-reward stock recommendation [PREMIUM PICKS]

Fire ideas will tend to be more adventurous and are designed for investors who can stomach a bit more volatility.

Read more »

Abstract 3d arrows with rocket
Growth Shares

Will the SpaceX IPO send this FTSE 100 stock into orbit?

How can British investors get exposure to SpaceX? Here is one FTSE 100 stock that might be perfect for those…

Read more »

Array of piggy banks in saturated colours on high colour contrast background
Investing Articles

Could drip-feeding £500 into the FTSE 250 help you retire comfortably?

Returns from FTSE 250 shares have rocketed to 10.6% over the last year. Is now the time to plough money…

Read more »

Passive and Active: text from letters of the wooden alphabet on a green chalk board
Investing Articles

How much does one need in an ISA for £2,056 monthly passive income?

The passive income potential of the Stocks and Shares ISA is higher than perhaps all other investments. Here's how the…

Read more »

Finger clicking a button marked 'Buy' on a keyboard
Investing Articles

The best time to buy stocks is when they’re cheap. Here’s 1 from my list

Buying discounted stocks can be a great way to build wealth and earn passive income. But investors need to be…

Read more »

Bus waiting in front of the London Stock Exchange on a sunny day.
Investing Articles

Martin Lewis just explained the stock market’s golden rule

Unlike cash, the stock market can quietly turn lump sums into serious wealth. So, what’s the secret sauce that makes…

Read more »

Close-up of British bank notes
Investing Articles

£5,000 invested in Greggs shares at the start of 2025 is now worth…

This year's been extremely grim for FTSE 250-listed Greggs -- but having slumped more than 40%, could its shares be…

Read more »

Investing Articles

Looking for shares to buy as precious metals surge? 3 things to remember!

Gold prices have been on a tear. So has silver. So why isn't this writer hunting for shares to buy…

Read more »