Many investors treat their Stocks and Shares ISA as something to sort out later in the tax year. After all, as long as the money goes in before the deadline, it shouldn’t really matter — right?
In reality, that delay could quietly cost thousands over time. The difference comes down to one simple factor: how long your money is working for you. Because when it comes to investing, even a few extra months of compounding each year can add up to a surprisingly large gap over the long run.
Maximise compounding
Over 25 years, the timing of ISA contributions creates a surprisingly large gap in wealth.
In this example, two investors both contribute £5,000 a year and earn the same 8% return. The only difference is when the money is invested.
One invests at the start of each tax year. The other waits until the end. That gap may feel insignificant in any single year, but compounding quietly amplifies it over time.
As the chart below shows, the divergence gradually builds into a final portfolio value difference of roughly £26,000.
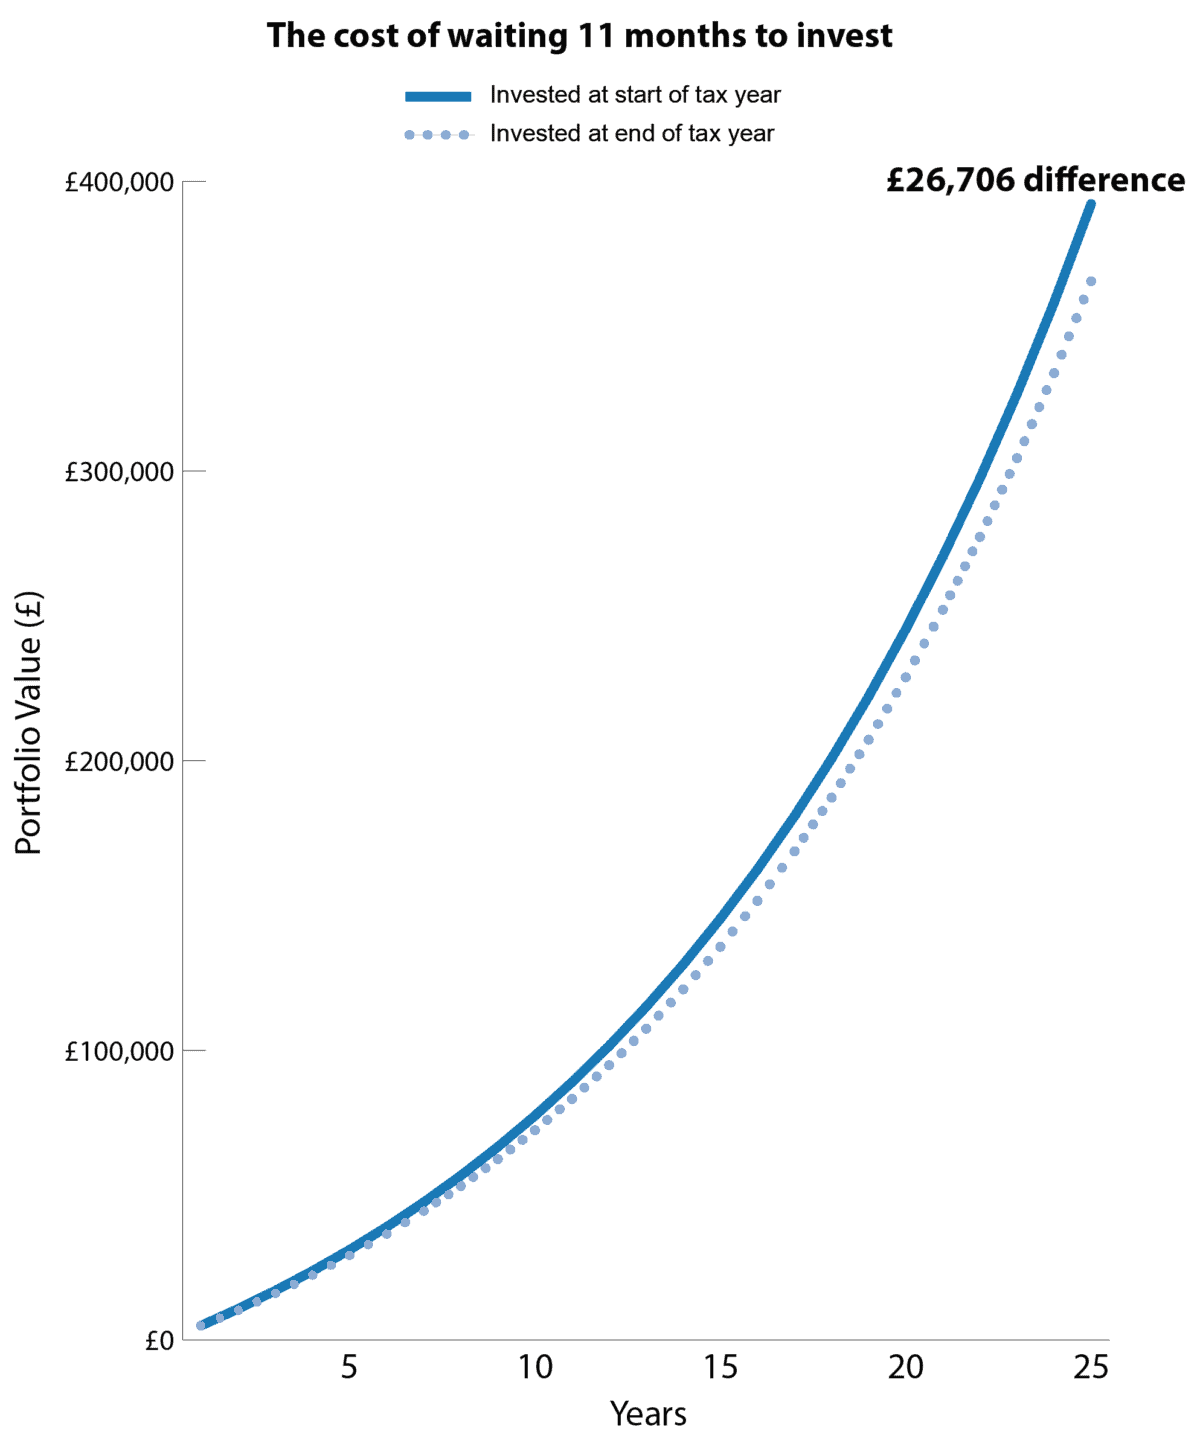
Chart created by author
Compounding in real markets
If a simple timing difference can create such a significant gap in a passive ISA portfolio, the same principle becomes even more powerful when applied to real-world stock market investing.
Unlike smooth compounding models, equity returns are uneven. A large proportion of long-term gains often comes from relatively short bursts of performance. That means being invested — and invested early — can matter far more than most investors realise.
A good example is BP (LSE: BP.). Over shorter periods, the share price can be heavily influenced by swings in oil prices, macro shocks, and shifting sentiment. This has been clearly evident recently.
But over decades, the real driver of returns has been the underlying cash-generation engine — production, cost discipline, and the ability to return capital through dividends and buybacks.
Dividends
This cash-generating engine is effectively compounding in action, but within BP rather than an investor’s ISA portfolio.
Even through oil price volatility, BP’s cash flows remain resilient. And it is this free cash flow that ultimately underpins dividend sustainability in a capital-intensive business.
| Financial metric | 2021 | 2022 | 2023 | 2024 | 2025 |
| Free cash flow (FCF) ($m) | 13,870 | 29,572 | 17,887 | 12,328 | 12,414 |
| FCF dividend cover | 3.22 | 6.79 | 3.72 | 2.46 | 2.45 |
Viewed through this lens, BP’s dividend is not a static payout, but the output of a compounding cash engine. That has enabled both sustained dividend payments and growth at a compound annual rate of around 11%, alongside ongoing buybacks.
Like all stocks, BP is not without risk. Higher oil prices can be a double-edged sword — if they rise too far, they can eventually dampen demand and tip economies into recession.
There are also execution risks around large upstream projects, as well as regulatory and political intervention in energy markets, which could affect capital allocation and long-term returns.
Bottom line
The real edge in investing is not timing the market, but time in the market. As both ISA compounding and companies like BP show, small delays compound into large long-term gaps. Most investors underestimate this. The real question is whether your money is working for you right now — or sitting on the sidelines, quietly costing you future wealth.