How I could invest £25 a day to target a £2,500 monthly passive income

With £25 a day, I could build a passive income worth £2,500 a month. I’m considering this golden portfolio allocation for steady growth.

The content of this article was relevant at the time of publishing. Circumstances change continuously and caution should therefore be exercised when relying upon any content contained within this article.

A senior group of friends enjoying rowing on the River Derwent

Image source: Getty Images

When investing, your capital is at risk. The value of your investments can go down as well as up and you may get back less than you put in.

Read More

The content of this article is provided for information purposes only and is not intended to be, nor does it constitute, any form of personal advice. Investments in a currency other than sterling are exposed to currency exchange risk. Currency exchange rates are constantly changing, which may affect the value of the investment in sterling terms. You could lose money in sterling even if the stock price rises in the currency of origin. Stocks listed on overseas exchanges may be subject to additional dealing and exchange rate charges, and may have other tax implications, and may not provide the same, or any, regulatory protection as in the UK.

You’re reading a free article with opinions that may differ from The Motley Fool’s Premium Investing Services. Become a Motley Fool member today to get instant access to our top analyst recommendations, in-depth research, investing resources, and more. Learn More.

sdf

With just £25 a day, I could build a passive income worth £2,500 a month. That is what the average worker in the UK earned in 2022. In my case, once I’d built up my savings pot, I could pay myself the same for doing sweet nothing-at-all.

Of course, it would take time and consistency. I’d also need to think carefully about where to invest my money. I’d want to be well positioned for everything the global economy might throw at me over the next 30 years.

The golden butterfly portfolio

Finance geeks have back tested hundreds of portfolio allocations, sharing their results on the internet.

One option I’ve seen is the golden butterfly portfolio. This is a simple strategy, which involves investing 20% in a total US stock market exchange-traded fund (ETF), 20% in a US small cap ETF, 20% in US short-term bonds, 20% in US long-term bonds, and 20% in gold.

When represented on a pie chart, the allocation looks somewhat like a butterfly (if you tilt your head and squint). In the diagram’s legend, I’ve given examples of low-cost ETFs I could use to get exposure to the market segments I want to target.

The golden butterfly portfolio: an example with low-cost ETFs

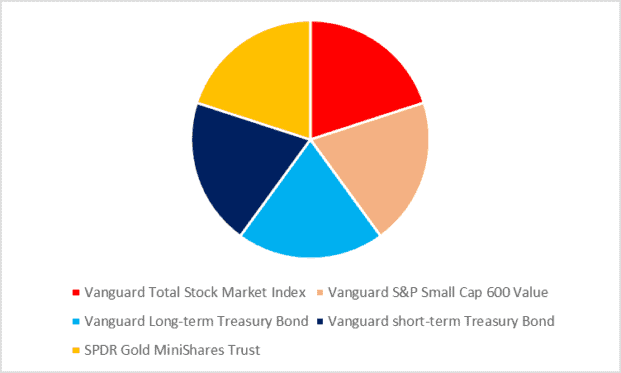
The beauty of the golden butterfly portfolio is that it sets me up for three scenarios. In the event of economic growth, its 40% equity allocation (red and pink in the chart) will race ahead. If, on the other hand, recession hits then the value of bonds (light and dark blue) will likely go up as investors flee into these “safe-haven” assets. Meanwhile, gold traditionally comes into its own during times of inflation.

Results from 152 years of testing

According to back-testing conducted by website Best Retirement Portfolio, the golden portfolio had the following historical performance:

  • Between 1871 to 2023, the portfolio granted a 6.94% annualised return;
  • The most it fell in a single year over that period was 50.14%;
  • In the worst-case scenario, you could have withdrawn 3.6% a year of your pot (adjusting for inflation) and not run out over 30 years.

Fattening up the portfolio

How much should I “feed” my golden butterfly?

I could put in £25 a day, or £9,125 a year. I could assume – based on 152 years of data – that it would grow by 6.94% a year.

After 10 years, I’d have £126,000. A decade later I’d have built up £372,000. And after 30 years of scrimping, I’d have £853,000.

Based on the past 152 years of market history, I could expect to withdraw 3.6% a year from my fully fattened-up golden butterfly and not run out of funds for at least 30 years.

Years of savingSize of retirement potPermitted draw-down amount per month (>30 years)
10£126,000£378
20£372,000£1,116
30£853,000£2,559
Source: author’s calculations, using assumptions from bestretirementportfolio.com

Risks

Past returns are no guarantee of future performance. Although my calculations are underpinned by 152 years of history, that still leaves room for error. What if, for example, the US turned into a complete economic basket case over the coming decades? I’d regret having chosen such American-centric funds.

I might offset that risk by choosing international ETFs, although I’d have to review my assumptions about growth and drawn-down rates, as the available data refer only to the US experience.

I plan to do more research into how the golden butterfly portfolio could be re-worked to make it more global in its exposure before pulling the trigger. That said, I remain a confident shareholder of multiple UK-listed stocks and will remain so for many years to come!

Should you invest, the value of your investment may rise or fall and your capital is at risk. Before investing, your individual circumstances should be assessed. Consider taking independent financial advice.

Views expressed on the companies mentioned in this article are those of the writer and therefore may differ from the official recommendations we make in our subscription services such as Share Advisor, Hidden Winners and Pro. Here at The Motley Fool we believe that considering a diverse range of insights makes us better investors.

More on Investing Articles

Close-up of a woman holding modern polymer ten, twenty and fifty pound notes.
Growth Shares

This FTSE 250 stock has beaten the index by around 10x over the last year

Jon Smith rates a FTSE 250 stock that has smashed the broader index performance and could keep going based on…

Read more »

Young woman working at modern office. Technical price graph and indicator, red and green candlestick chart and stock trading computer screen background.
Investing Articles

B&M shares are at record lows! Is now the time to consider buying?

The retailer, demoted from the FTSE 100 to the FTSE 250 last year, continues to struggle. But are B&M shares…

Read more »

Investing For Beginners

2 reasons why the stock market could hit 10,000 points by December

Jon Smith explains how the makeup of the UK stock market and the current valuation could support a move towards…

Read more »

Queen Street, one of Cardiff's main shopping streets, busy with Saturday shoppers.
Investing Articles

Why this FTSE 100 rocket is this investment trust’s number 1 holding

A UK investment trust is certainly going against the grain by having this FTSE 100 share as a high-conviction holding…

Read more »

UK financial background: share prices and stock graph overlaid on an image of the Union Jack
Investing Articles

These 2 FTSE growth stocks jumped 8% and 4.5% today!

Ben McPoland takes a closer look at a pair of FTSE stocks that are performing really well recently. Why are…

Read more »

Road 2025 to 2032 new year direction concept
Investing Articles

This under‑the‑radar FTSE 100 growth stock is also a secret dividend superstar!

Harvey Jones belatedly wakes up to a brilliant FTSE 100 growth stock that has an equally remarkable track record of…

Read more »

Business manager working at a pub doing the accountancy and some paperwork using a laptop computer
Investing Articles

Barratt Redrow share price plunges 9% on profits hit – time to consider buying?

Harvey Jones says FTSE 100 housebuilders continue to suffer with the Barratt Redrow share price slumping on a profit warning.…

Read more »

UK financial background: share prices and stock graph overlaid on an image of the Union Jack
Growth Shares

Why the next month could make or break the Lloyds share price

Jon Smith outlines two key events in coming weeks that could influence the Lloyds share price, leading him to make…

Read more »